
Prism Microclimate · a Prism Labs product
Every field in North Dakota, on one map.
961,439 field boundaries. Find your field in any of the 53 counties, or start with the Harwood example farm. A seven-day forecast for your field, 38 years of risk and economics for your county.
Open to anyone, free in the browser, with no account and nothing to install. Your own farm's sensors and records join it through Prism Desktop, on your own machines.
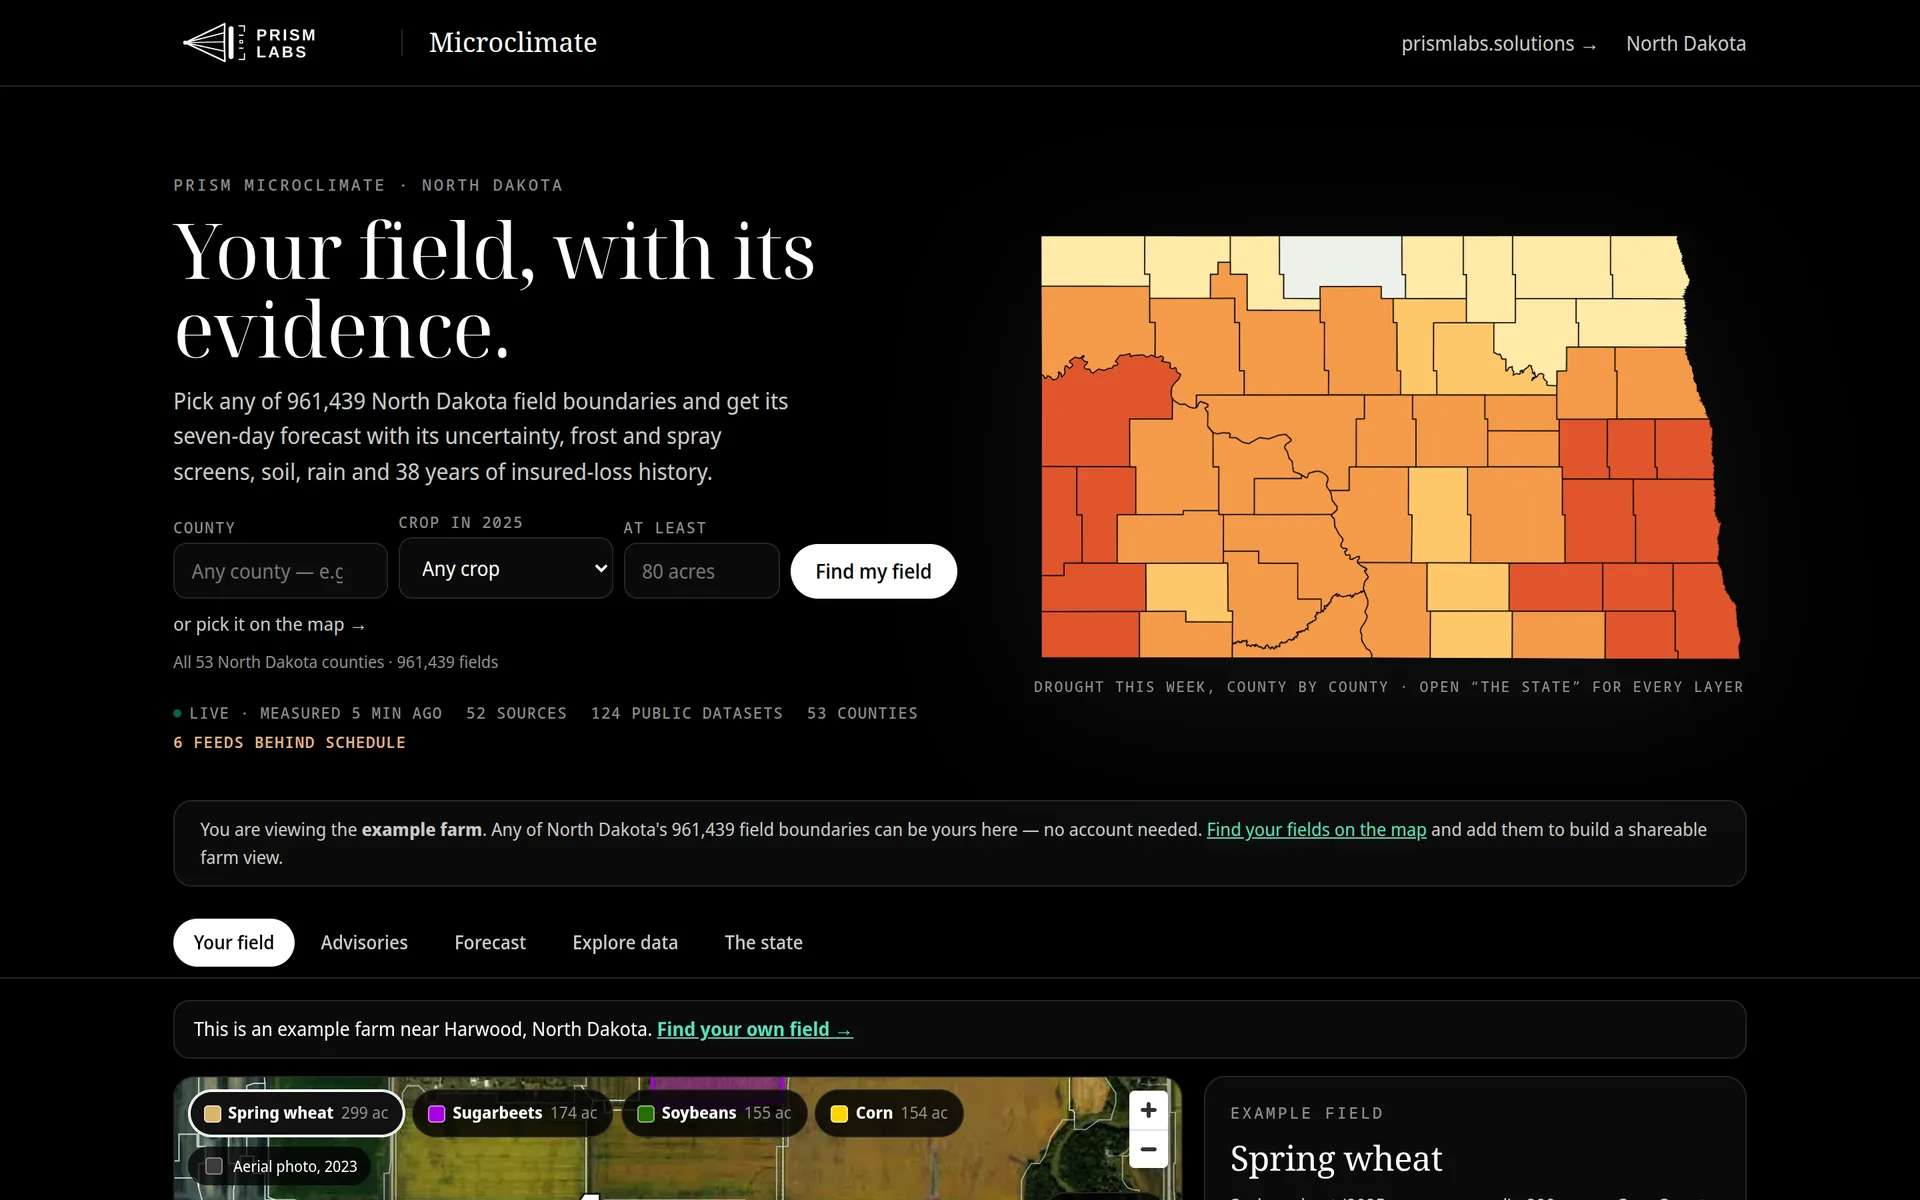
The live product, as it runs today
In numbers
The record behind every card.
961,439Field boundaries across North Dakota, searchable, pin your own farm
53Counties, every field in each of them
38Years of insured-loss history per county, crop and peril
See
The state, county by county. Your field, boundary by boundary.
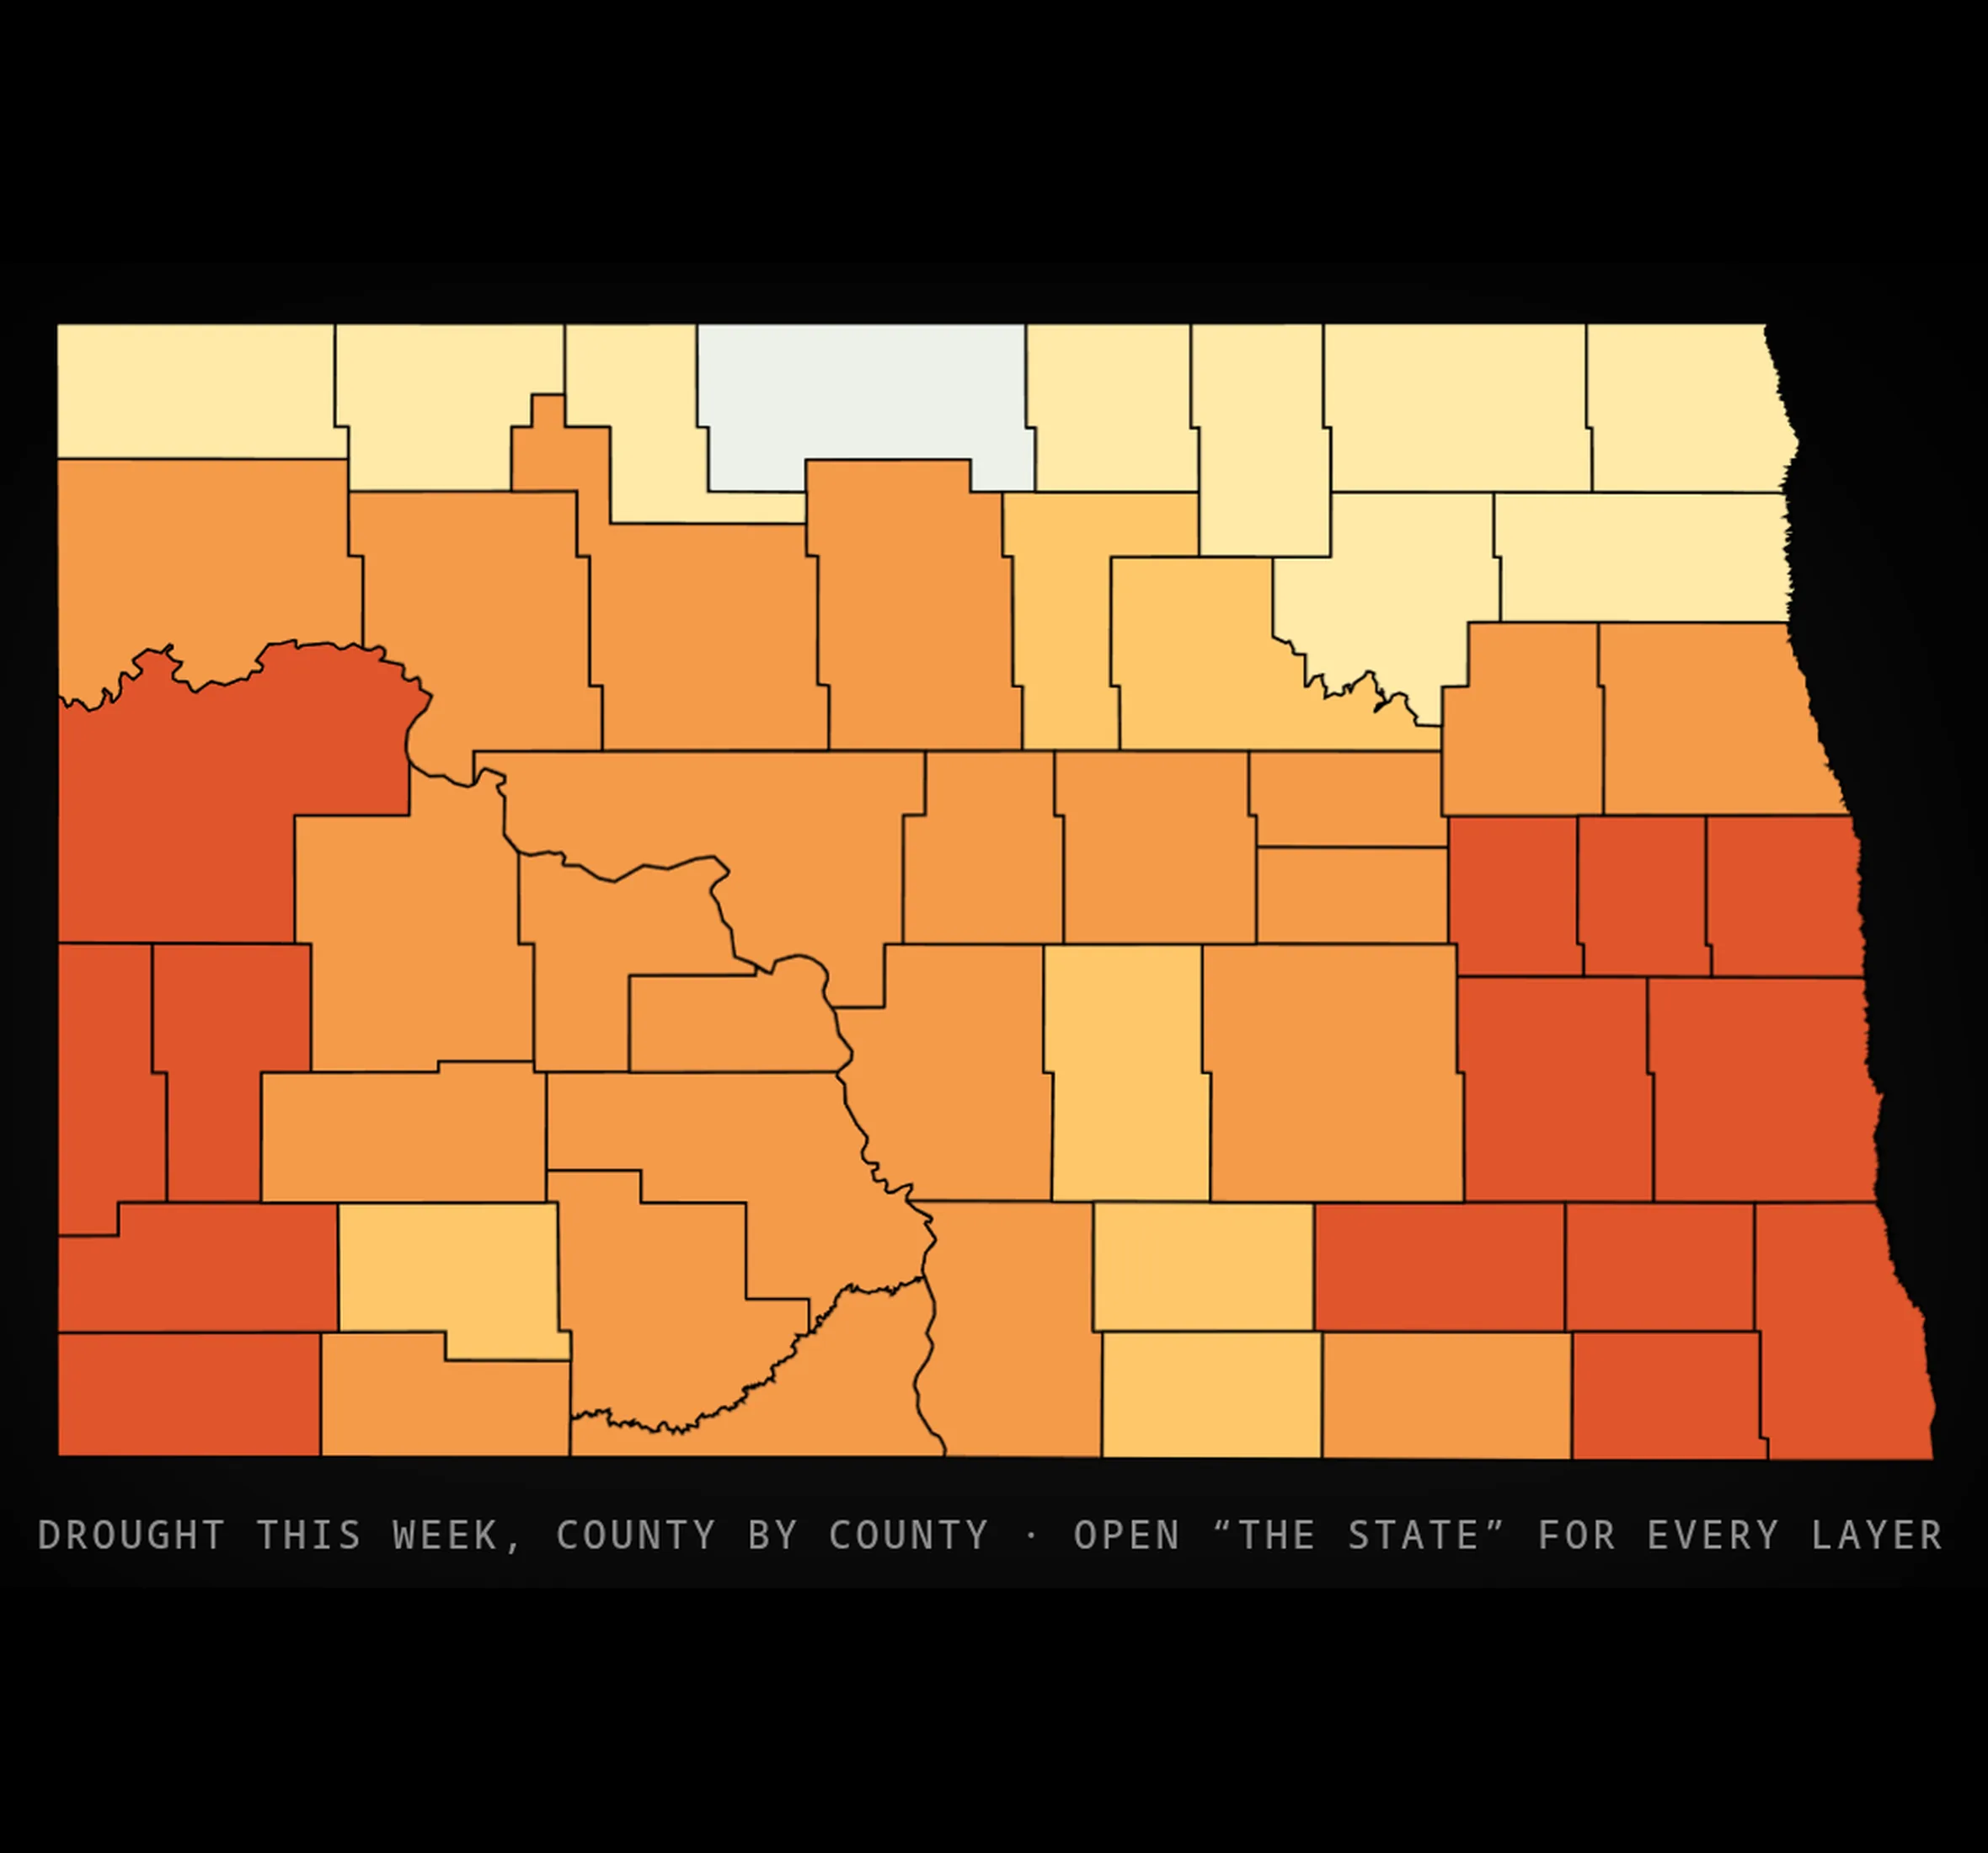
- Every field on one map.961,439 boundaries, coloured by crop, with a filter. Hover over a field for its details, search for a place or use your location, and pin your own farm. Everything below resolves to it.
- Five county layers.Drought this week, what perils actually cost, what land rents for, wheat yields, and where the acres are, over 53 counties.
- Live conditions.Weather, rain, soil, snow and water for the state and your field, each marked as updating live, slowly, or fixed.
- Imagery and terrain.Switch between a satellite view, an aerial photo and your field's latest satellite picture, with terrain shading underneath.
- Your own outline.If your field is drawn differently from the map, draw your own outline or upload one, and the answers follow it.
Open these fields in Map Studio → The boundaries are a ready layer under My Data, beside your own files. About Map Studio
Example farm
Four real fields near Harwood, North Dakota.
Open Prism Microclimate and an example farm is already there: four neighbouring fields, each with its own forecast, windows and history. Look around, then find your own field.
Corn
154 acres
Soybeans
155 acres
Spring wheat
299 acres
Sugarbeets
174 acres
Plan
Seven days ahead, with the doubt shown.
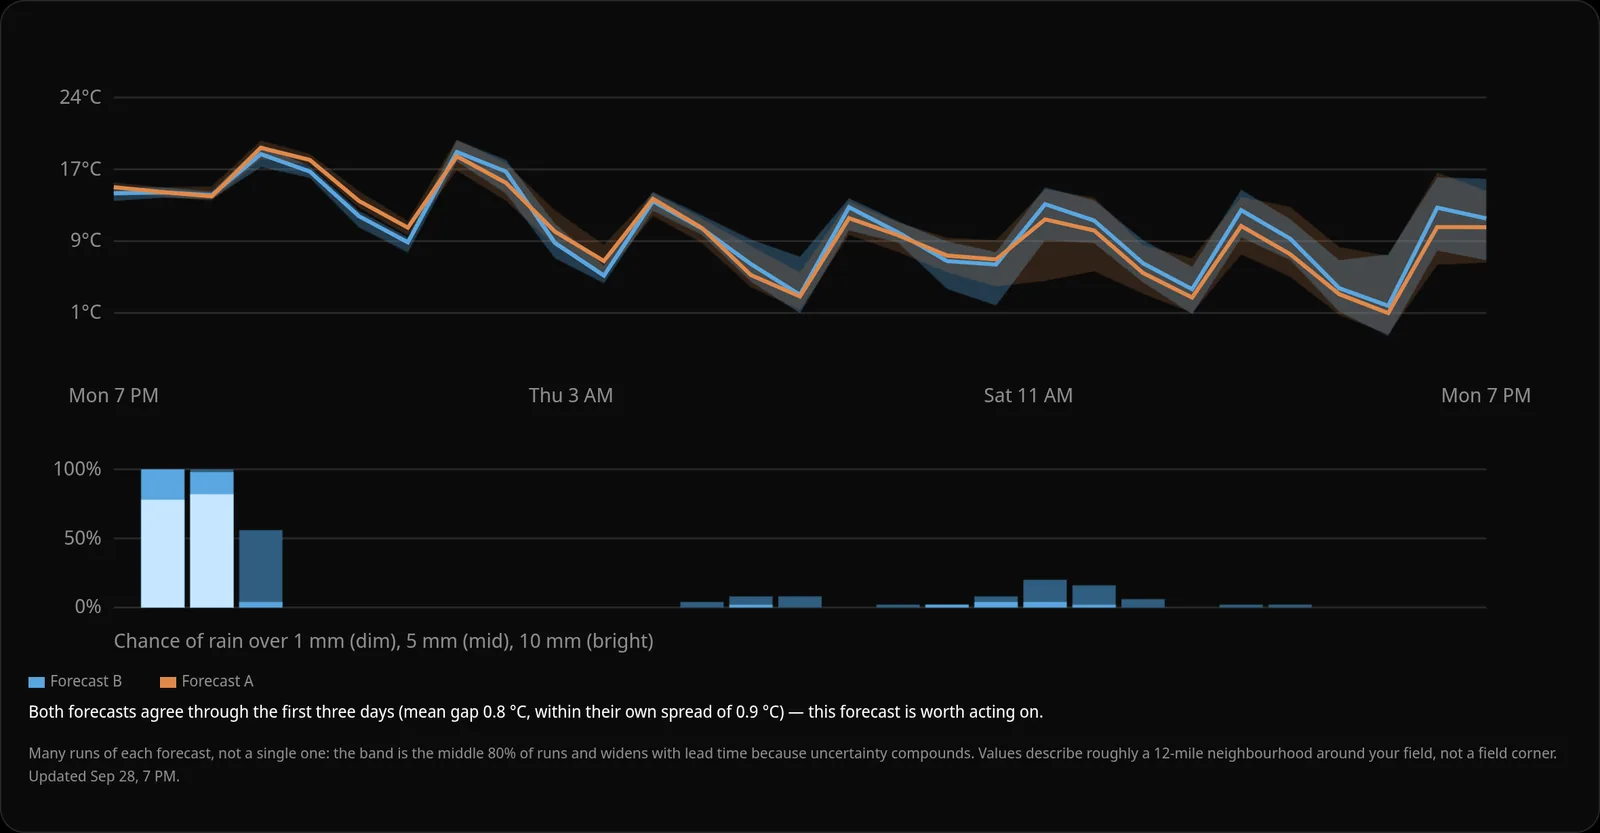
- A week ahead, with the doubt shown.Temperature, rain and frost chances for your field, a week ahead. The band shows how sure the forecast is; it widens further out, as it should.
- Rain and frost as probabilities.The chance of more than 1, 5 or 10 mm, and of 2 m temperature below freezing, for the field you picked.
- Plain answers first.Rain, the spray window, frost or heat, crop stage, disease risk and crop health for each field, before any chart.
- Windows and stages.Frost, spray and field-work windows; growing degree days and crop stage against similar years.
Understand
Thirty-eight years of risk, crops and economics.
Peril risk
What each peril costs, by county and crop
Frequency, severity per acre, loss ratio, the worst year and the peak month, from 38 years of insured losses.
Season against history
This year, against the same county's past
Conditions, progress and yields against 38 years of the same crop in the same place.
Farm economics
Rents, land values and budgets
County cash rents and land values, state income and expense series since 1997, projected crop budgets and programme acres, with their gates stated.
Your field
Everything for one boundary
Forecast, soil, rain, water and peril history resolve to the field you pinned, with the number of years behind each figure stated.
Honest numbers
Clear about what every number is.
- Measured or modelled, always labelled.Every value says whether it was observed, estimated or forecast, and how close the evidence is to your field.
- Cautions are never cut.Each card carries its limitation in plain words, so you know how far to lean on it before you act.
- Missing stays missing.Measured, estimated, missing and suspect are kept apart. Nothing is invented to fill a gap.
Records
Kept current, on schedule.
Every record behind the page is refreshed on its own schedule, so the numbers for your field are never stale without saying so.
Pilots
We attach to what you already run.
Prism Microclimate is the public record under your fields, free to use. A pilot adds yours, on your own machines.
- Your weather station and soil probes.Any make. The cards for your field flip from modelled to measured, and every public number is checked against your probe.
- Your machine records.As-planted, as-applied and yield maps from the farm-management system you already use, by export or an authorised connection. Growth stage by the hybrid you planted; yield against weather and soil.
- Your notes, hybrids and contracts.Scouting notes and photos sharpen the disease risk for your fields; hybrid history sharpens frost and crop-stage calls; grain contracts turn statewide bids into your position.
- Your portfolio.Agronomists, co-ops, lenders and insurers: fields under management or on the books become one workspace, county peril history becomes a portfolio view. Data never leaves your organisation.
Where it stands
Where it stands, and what comes next.
A working product, open to anyone: all 961,439 North Dakota field boundaries, a seven-day forecast for each field with frost and rain chances, 38 years of county risk history, and every number labelled measured, estimated or forecast. Not yet done: accuracy measured against the season's ground truth, grower alerts, and use on a working farm.
- Forecast accuracy measured against the 2026 season.
- Grower alerts for frost, rain and spray windows, and a field view.
- Pilot agreements with North Dakota growers for spring 2027.
Validation happens in the field: pilot growers' own sensors checked against the forecast, with the accuracy figures published. That is the evidence for first revenue and for wider field trials.